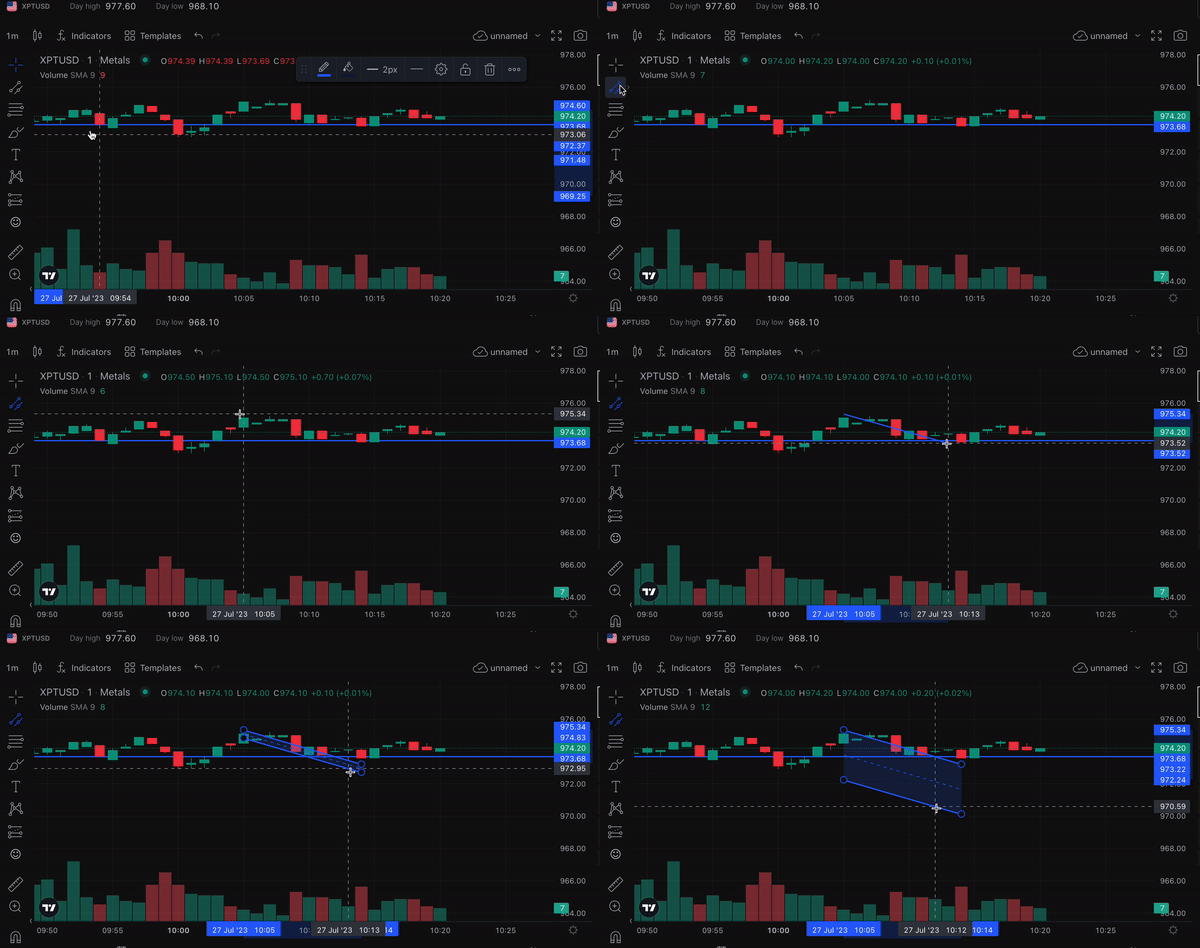
The parallel channel tool is a valuable feature in TradeLocker that allows you to draw parallel lines on your chart to identify price channels. This tool is especially beneficial for PROP365 traders who want to visualize trends and key support/resistance levels within a defined price range.
The parallel channel tool is ideal for capturing trending market conditions and helps you recognize potential entry and exit points. It is particularly useful for swing traders who take advantage of price fluctuations within a channel. Additionally, the tool can help spot divergences between price movements and indicators, providing further confirmation for your trades.
Select the asset you want to analyze
- Select the instrument or currency pair you want to analyze on the chart.
- Locate the toolbar on the left side of the chart.
- Click on the parallel channel tool icon, represented by two parallel lines.
- Position the cursor at the point where you want to start the channel. Left-click to place the starting point and the endpoints of the first line.

Drag to create support and resistance lines
Drag the cursor to the desired position for the second line parallel to the first line and left-click to complete the channel.
- You can adjust the width and the angle of the channel lines by selecting their lines and dragging the dots at the center of the extremity of the channel.

By using the parallel channel tool on your PROP365 account, you’ll be able to capture more accurate trends and price movements, improving your ability to make informed trading decisions.
 Help Center